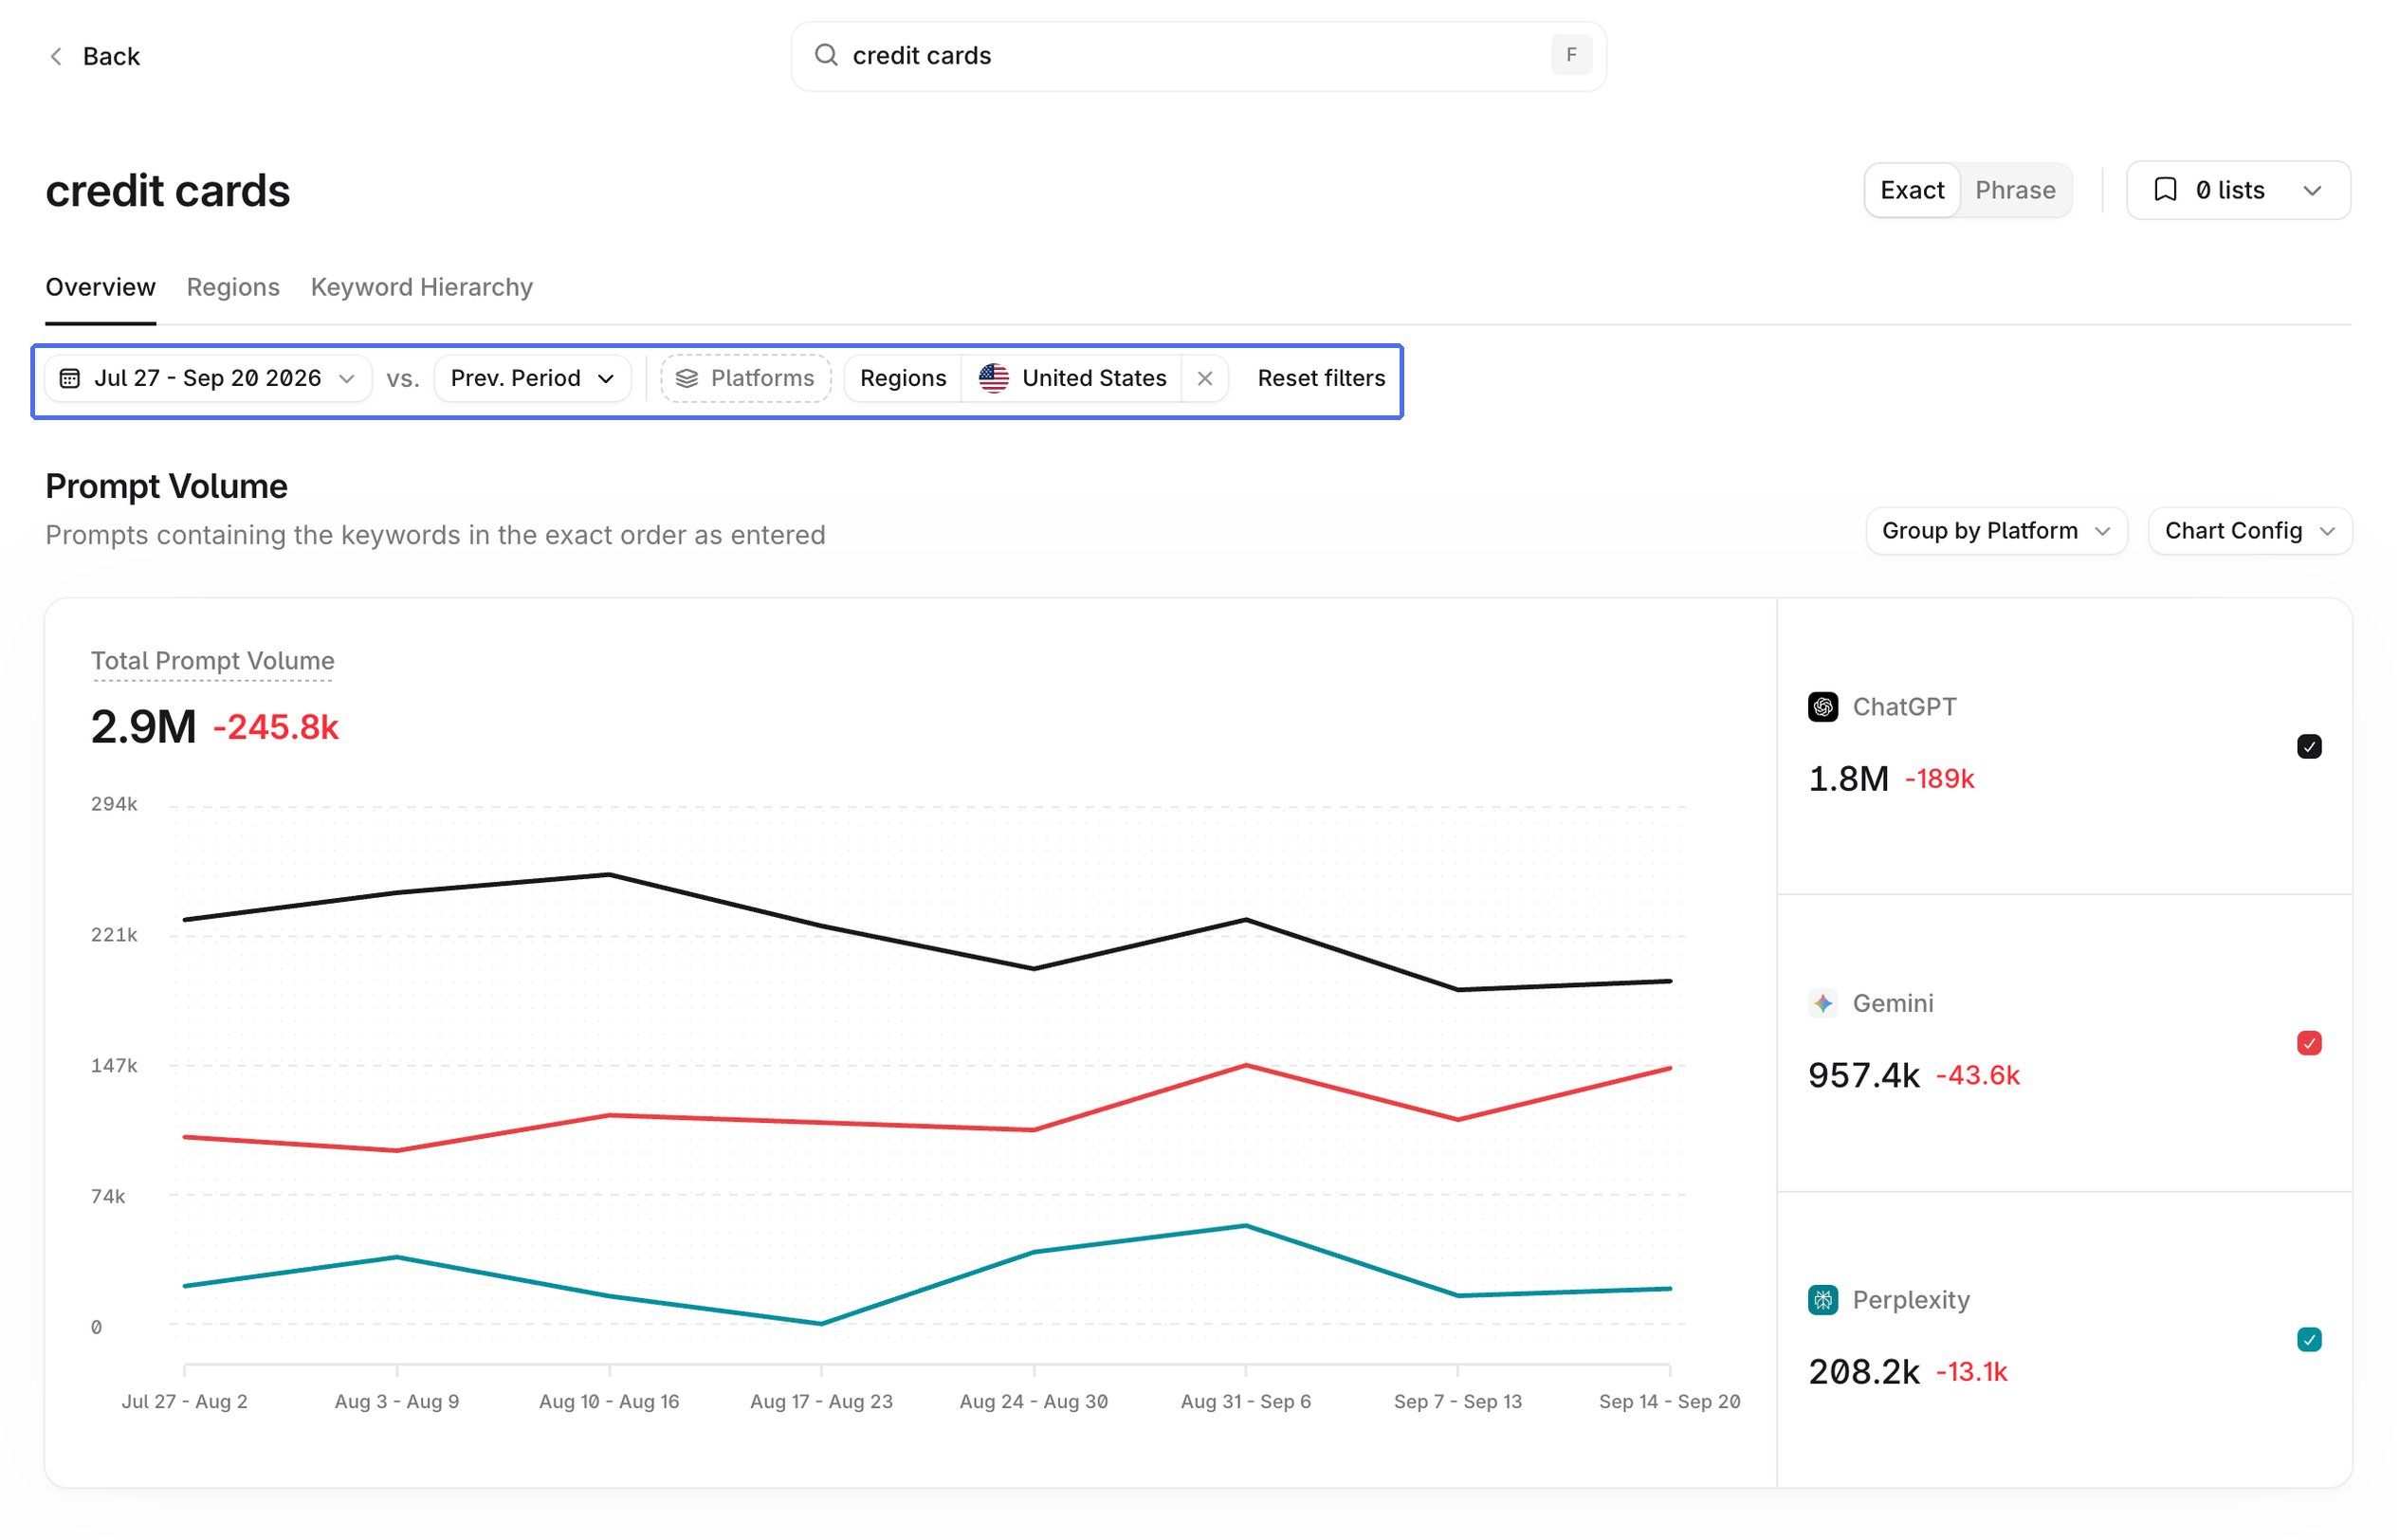
Overview tab
The following charts and tables provide an overview of your keyword query results. Use these to understand the volume of prompts that contain your queried keywords.Prompt Volume
The Prompt Volume chart shows how many keyword matches Profound found in the prompt dataset. Adjust the visualization using the Chart Config controls above the chart. Display results as either a line or bar chart, and group results by platform or show them without grouping.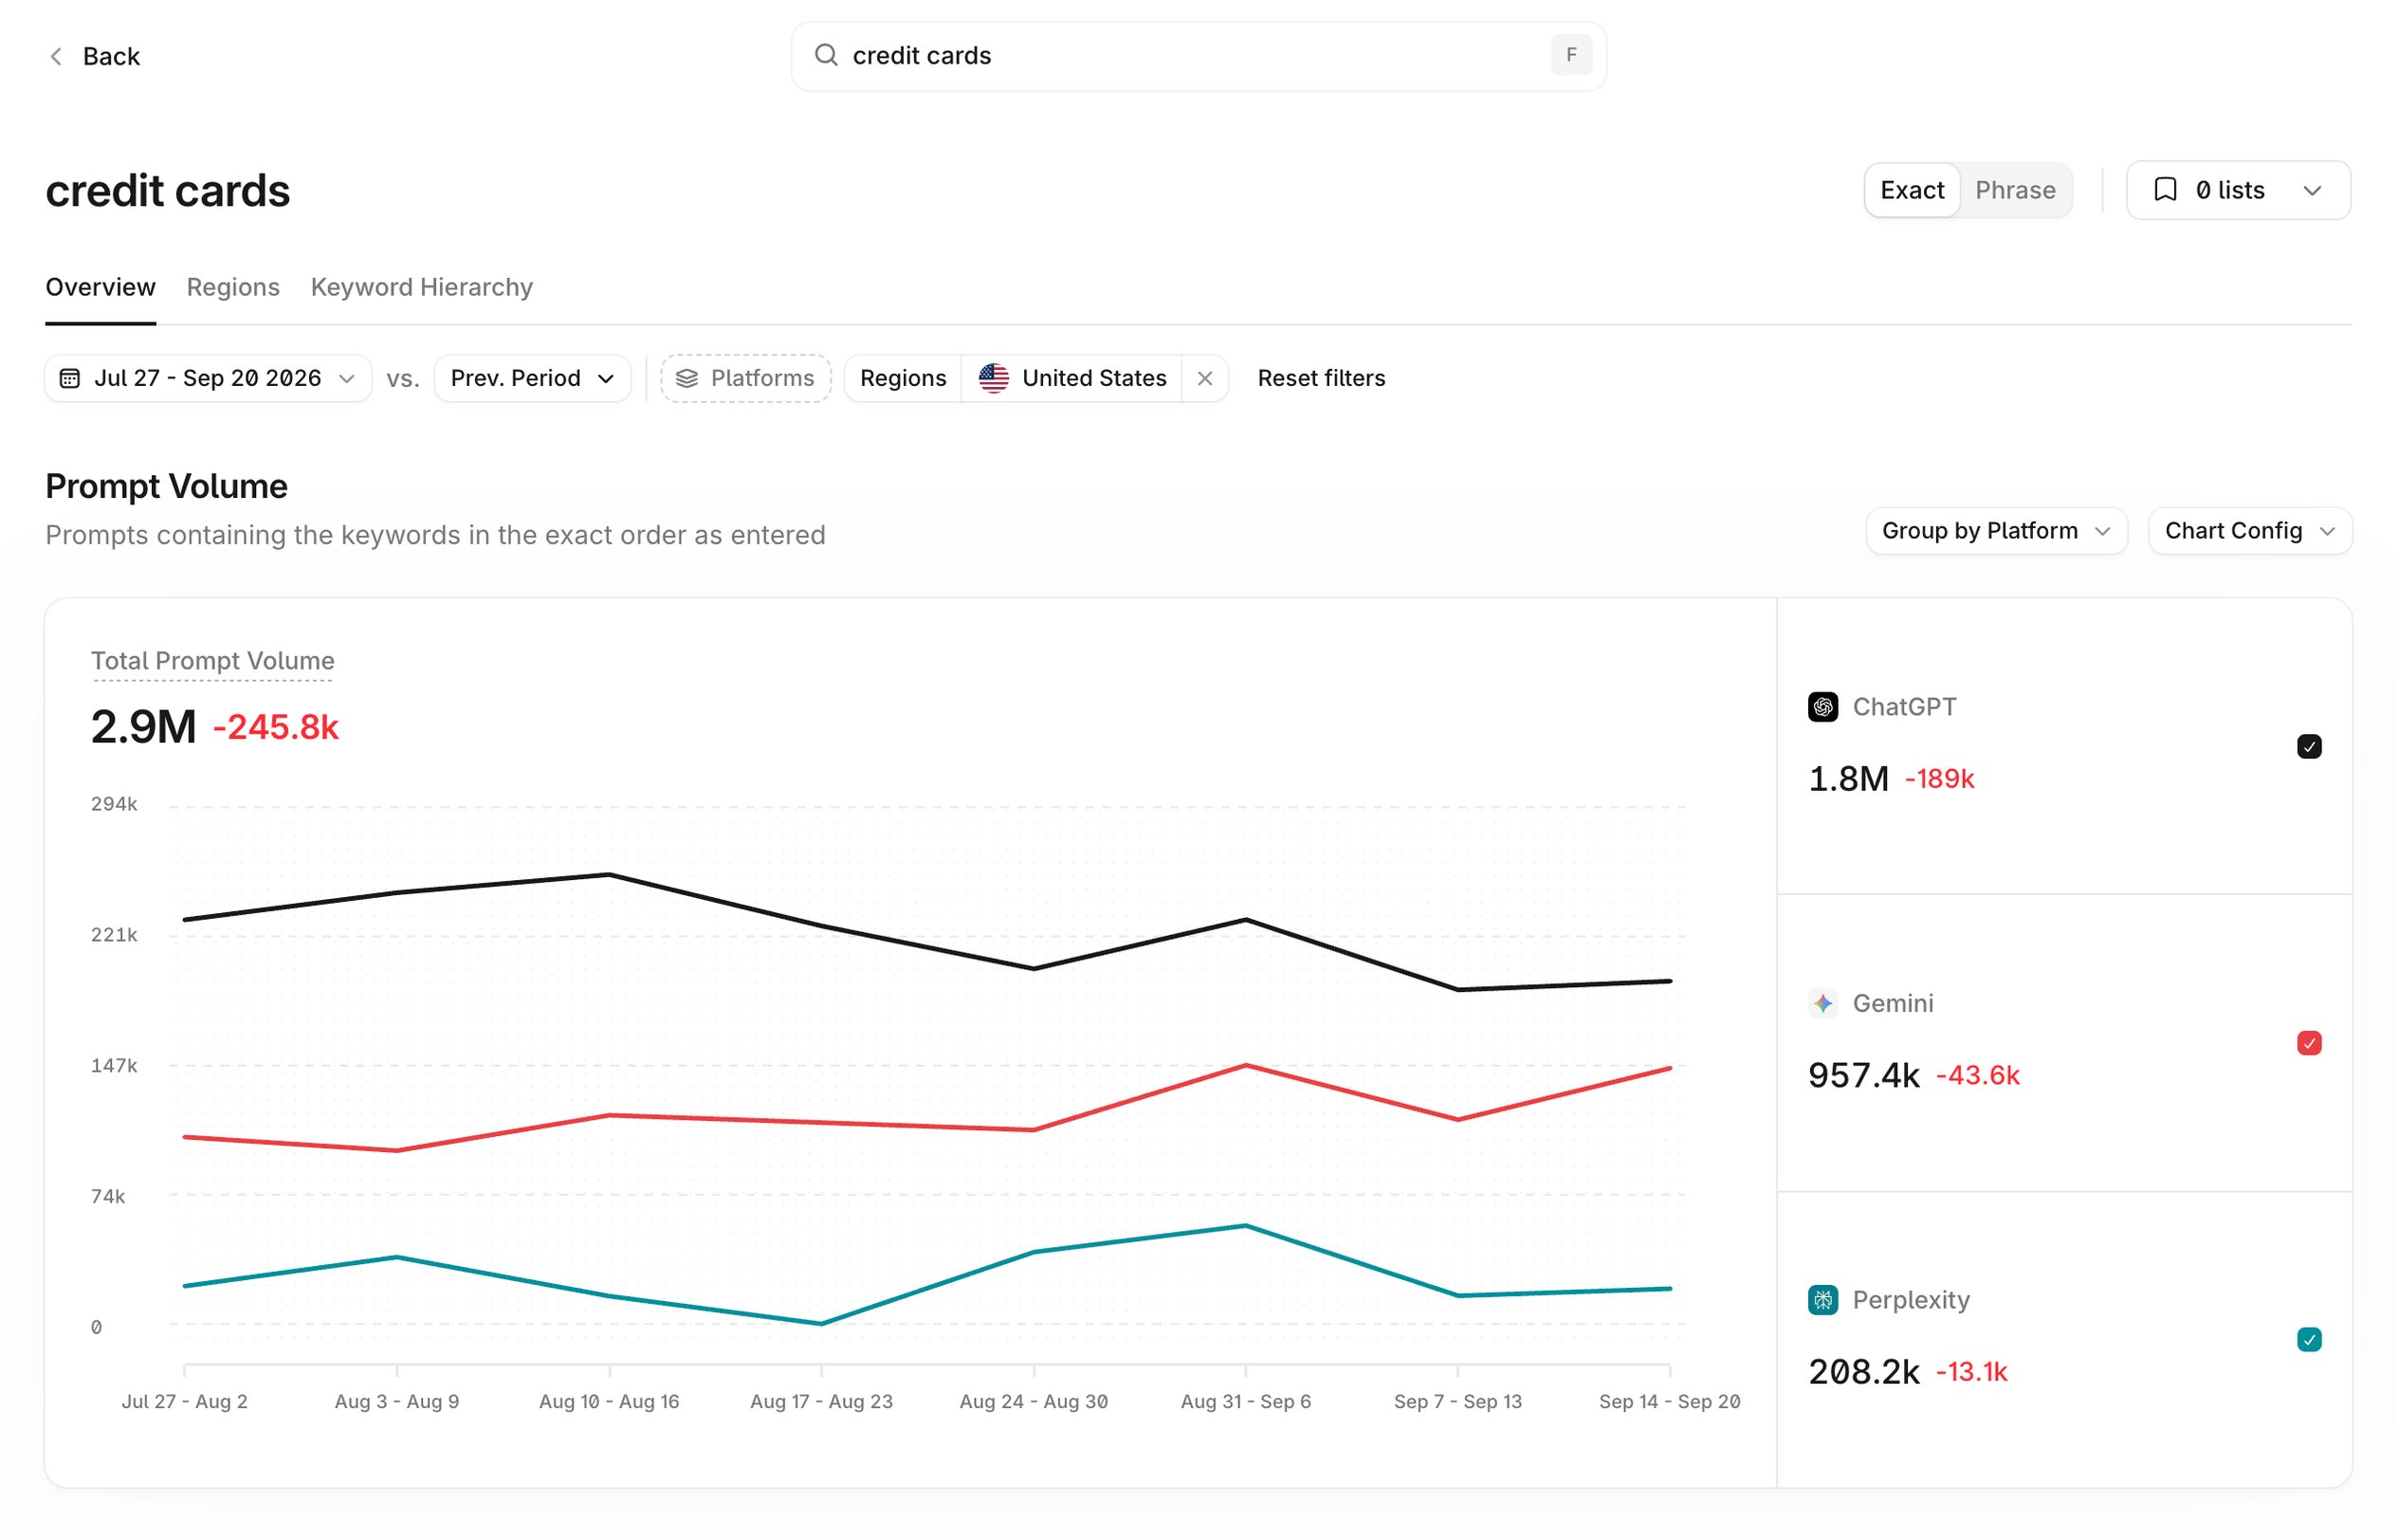
Conversation Share by Intent
The Conversation Share by Intent chart shows the share of conversations by intent, based on a representative sample of user conversation data over the selected time range. Profound classifies intent as informational, commercial, conversational, or generative (requests to create content).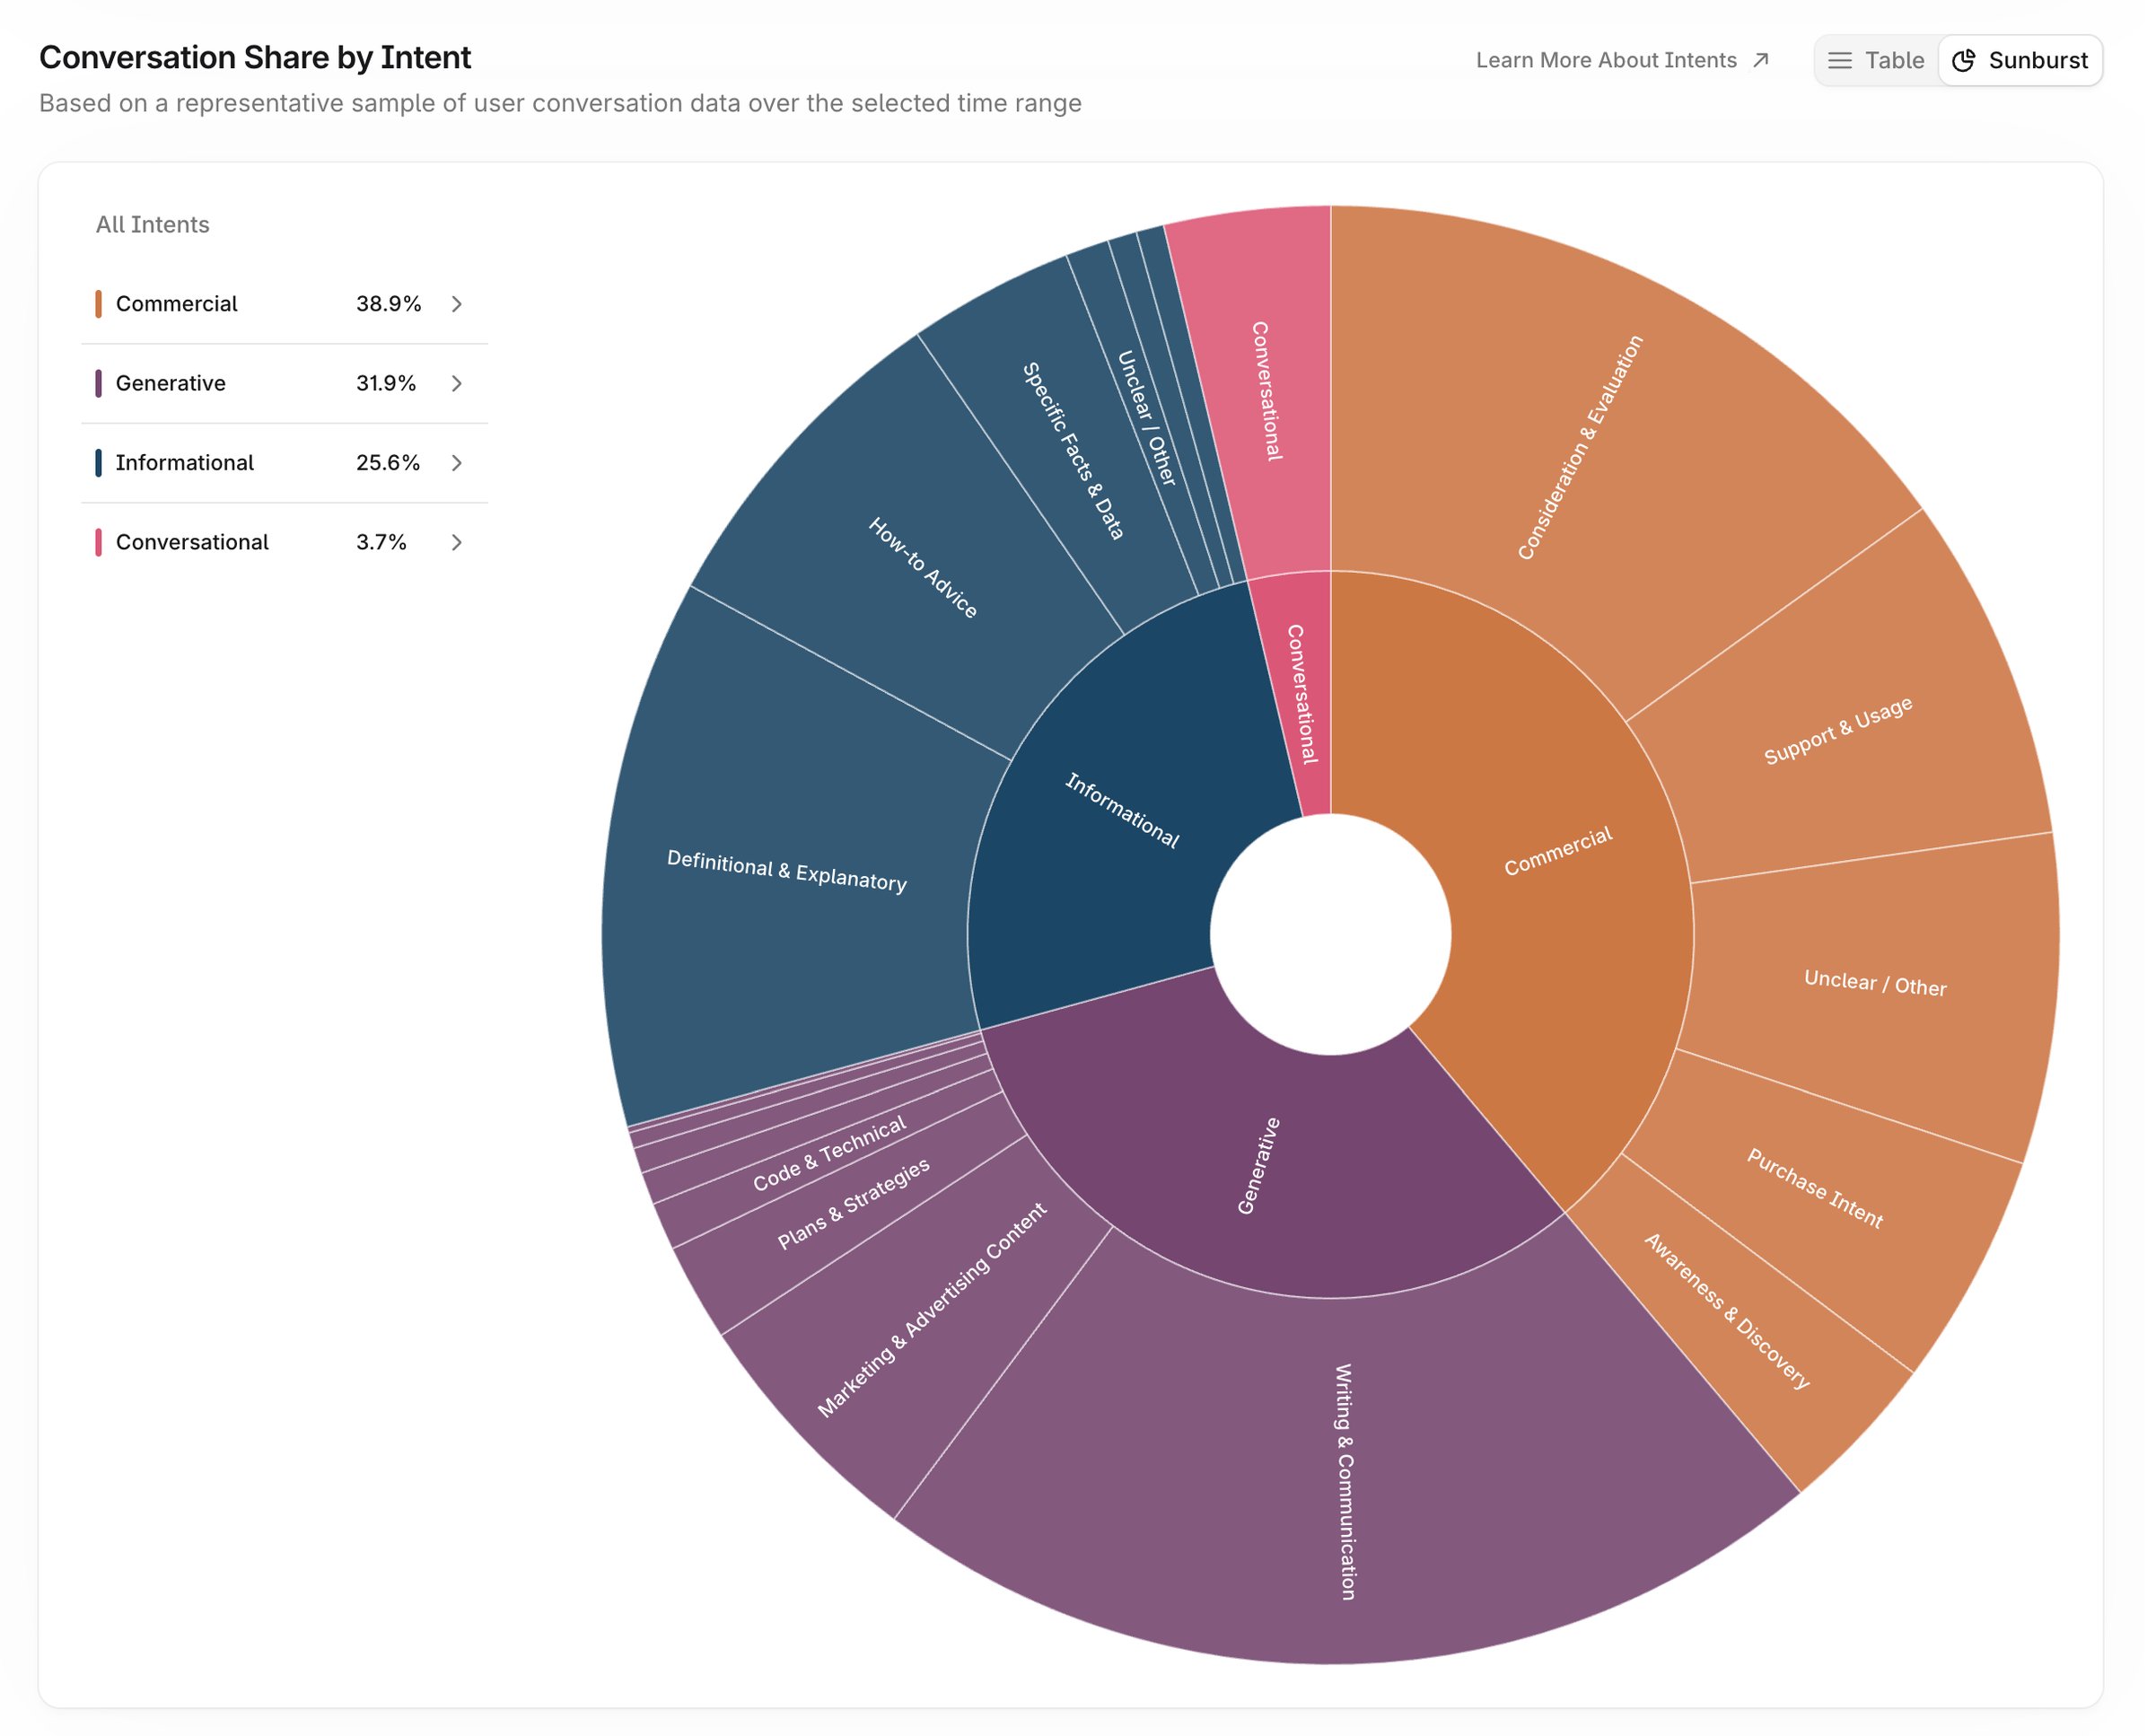
Similar Keywords
The Similar Keywords table displays keywords that commonly appear in similar prompting patterns. Select any keyword in this list to run a new query for that term.Prompts tab
The Prompts tab connects what people ask AI about your keyword with the prompts worth tracking.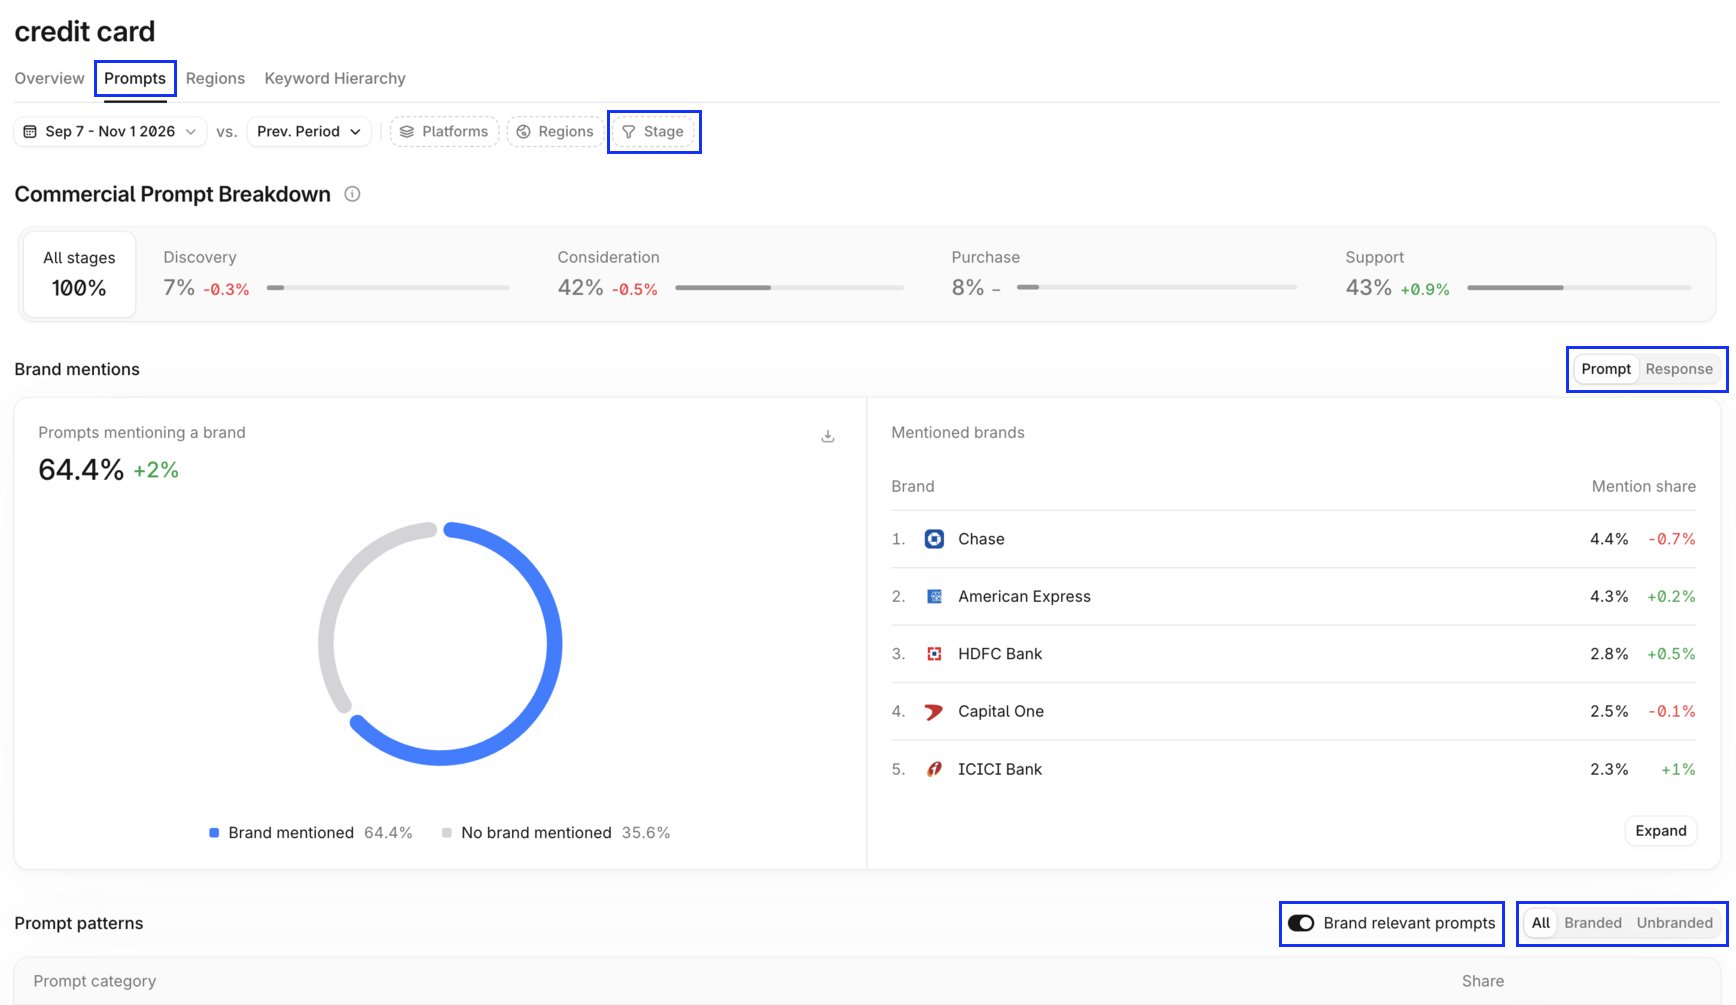
- Understand intent. The Commercial Prompt Breakdown groups prompts into Discovery, Consideration, Purchase, and Support stages. Use the stage filter next to the Platforms and Regions filters to focus on one stage.
- See where brands show up. The Brand mentions card compares branded and unbranded demand and lists the most-mentioned brands. Switch between Prompt and Response to see brands mentioned in prompts or in answers. The card measures changes against the previous period.
- Discover prompts worth tracking. The Prompt patterns table shows common prompt patterns, filtered by All, Branded, or Unbranded. Open a pattern to see prompt examples. Turn on Brand relevant prompts to tailor the examples to your brand.
- Act on the findings. Track an example in Answer Engine Insights. To get more examples, select Create more with Aim to ask AI Marketer (Aim) for prompts like the one you opened.
Regions
The Regions tab displays keyword query results broken down by region. The Prompt Volume by Region chart is a heat map showing the volume of prompts containing the queried keyword across geographic regions. A table to the right lists the prompt counts for each region.Keyword Hierarchy
The Keyword Hierarchy tab contains an interactive hierarchy chart. The queried keyword heads the chart. Subsequent levels show expanded keywords and their corresponding prevalence in the results.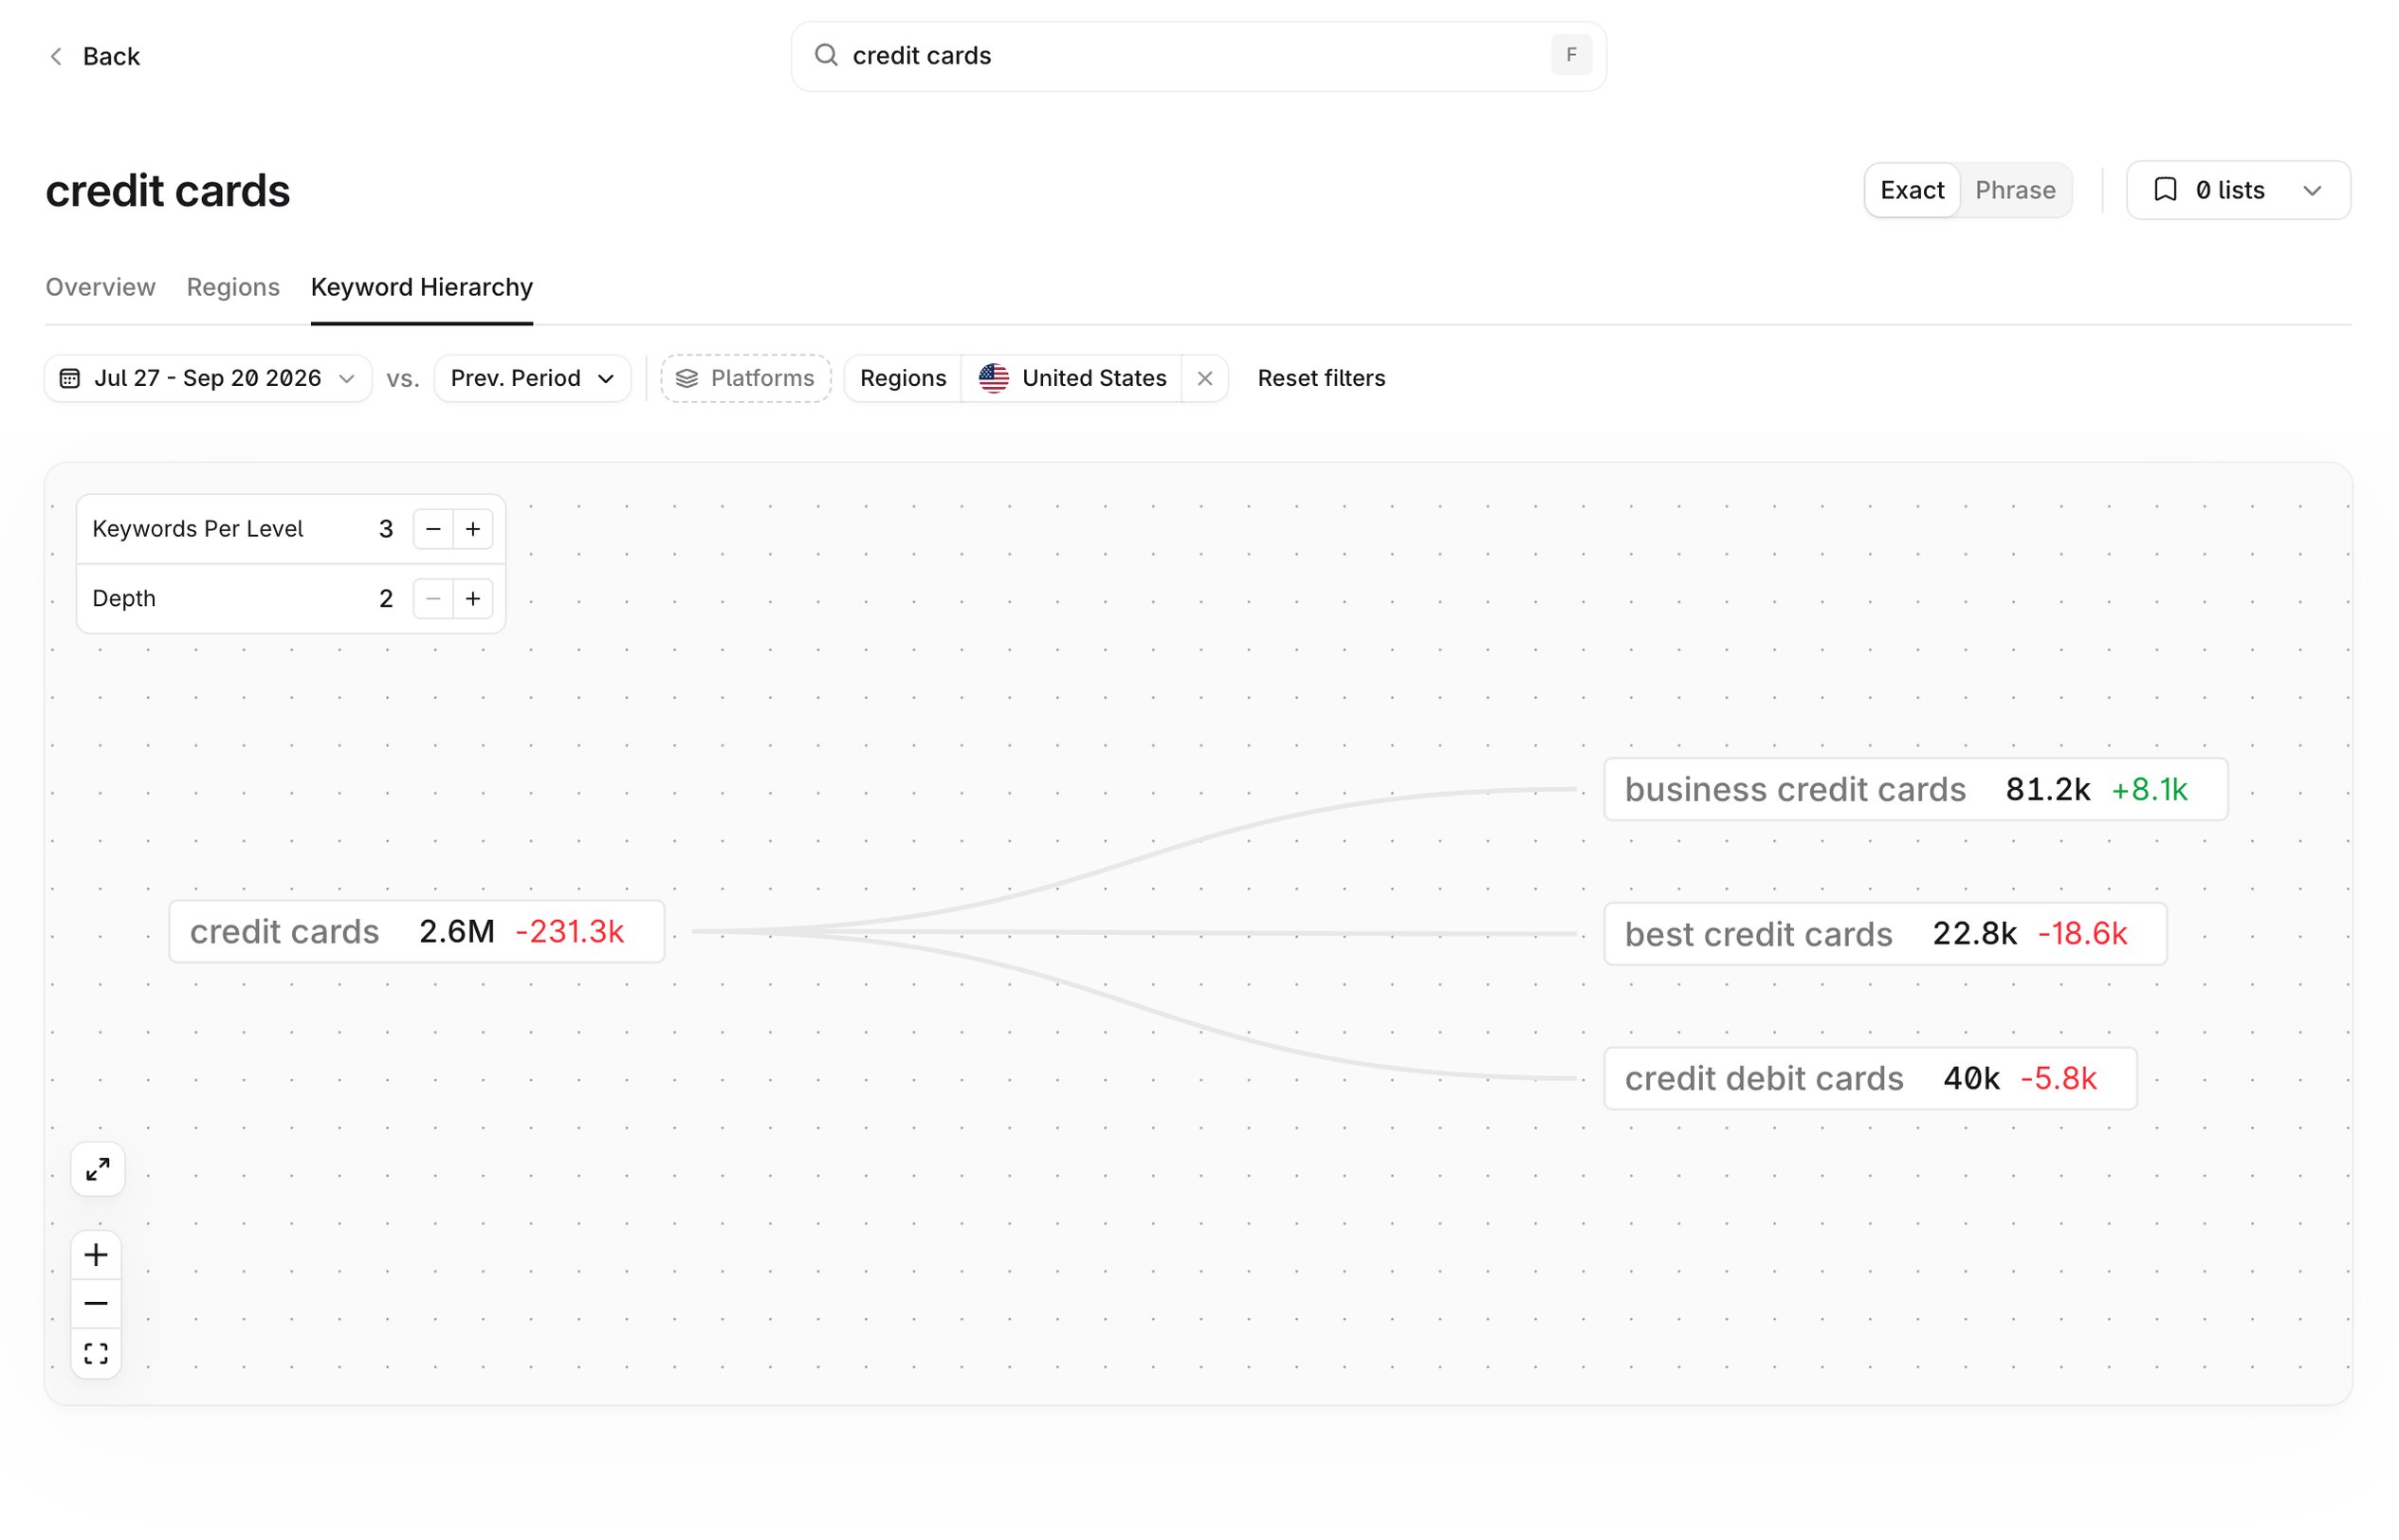
Filters
Filters apply across Prompt Volumes and let you adjust the analytical time frame and narrow the data view. Filters appear as dropdown menus beneath the tabs.